Published-release documentation · release compatibility
Violin Plots
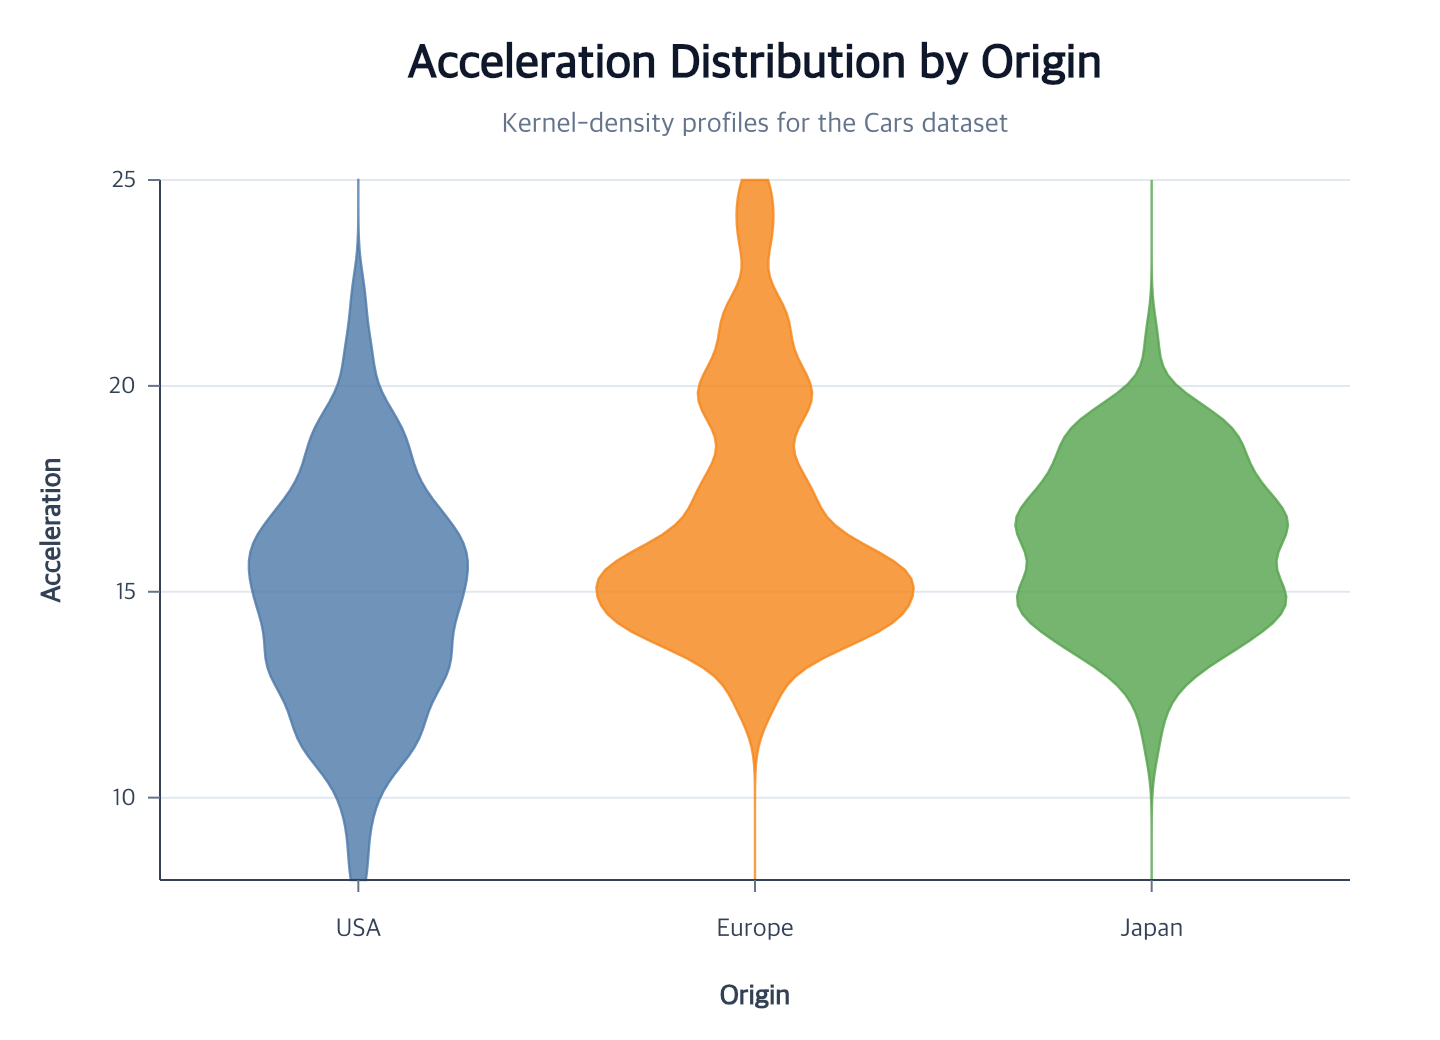
Use createViolinPlot to compare kernel-density profiles inside categorical
bands. It accepts the same categorical/quantitative x/y role family as box and
gradient plots, then infers orientation from the complete field pair.
Minimal vertical violin
Contextual fragment. Use an ES module with the imports, data, and prepared resource state described in this section. Resolve these names from setup in this fragment or section; alternatives branch from the same base.
const program = chart()
  .createCanvas()
  .createData({ values })
  .createViolinPlot({
    id: "violins",
    x: "category",
    y: "value"
  });
The action creates an area mark, immutable density data, category and value scales, full closed paths, and applicable Cartesian guides. Field types are inferred when the current dataset makes one categorical and one quantitative role unambiguous.
Density width and orientation
Contextual fragment. Use an ES module with the imports, data, and prepared resource state described in this section. Resolve these names from setup in this fragment or section; alternatives branch from the same base.
.createViolinPlot({
  x: { field: "value", fieldType: "quantitative" },
  y: { field: "category", fieldType: "nominal" },
  density: {
    bandwidth: 0.8,
    extent: [0, 30],
    steps: 80,
    width: { band: 0.7, resolve: "independent" }
  }
})
width.band is the fraction of each categorical band available to the full
shape. resolve: "shared" uses one density maximum across categories;
"independent" gives each category its own maximum. The default is
{ band: 0.8, resolve: "shared" }.
For weighted observations, put the definition inside density:
Contextual fragment. Use an ES module with the imports, data, and prepared resource state described in this section. Resolve these names from setup in this fragment or section; alternatives branch from the same base.
.createViolinPlot({
  x: "category",
  y: "value",
  density: {
    weight: { field: "surveyWeight", kind: "reliability" }
  }
})
Each category or split profile uses its own positive-weight membership. The same weighted rules determine unit/count density and automatic bandwidth.
Split a category into two halves
Contextual fragment. Use an ES module with the imports, data, and prepared resource state described in this section. Resolve these names from setup in this fragment or section; alternatives branch from the same base.
.createViolinPlot({
  x: "category",
  y: "value",
  split: {
    field: "period",
    domain: ["early", "late"]
  },
  color: {
    field: "period",
    scale: { range: ["#4c78a8", "#e45756"] }
  }
})
A split must contain exactly two observed values. The first domain value owns the left or top half and the second owns the right or bottom half. When the domain is omitted, ggaction uses first-appearance order only if exactly two values are observed.
Appearance and guides
Contextual fragment. Use an ES module with the imports, data, and prepared resource state described in this section. Resolve these names from setup in this fragment or section; alternatives branch from the same base.
.createViolinPlot({
  x: "category",
  y: "value",
  color: "category",
  area: { opacity: 0.7, strokeWidth: 1.5 },
  guides: { legend: false }
})
When strokeWidth is supplied without a constant stroke, each outline follows
its materialized fill. A category-color legend is omitted by default because
the categorical axis already identifies the same field; request
guides: { legend: {} } to show it explicitly.
The area style also accepts lineCap, lineJoin, and miterLimit from the
shared Mark Style
contract.
Editing
createViolinPlot creates a stable owner. Revise its data and statistical
roles together:
Contextual fragment. Use an ES module with the imports, data, and prepared resource state described in this section. Caller-provided receivers:
program. Resource selectors used here:target: "violins";data: "revised". Resolve these names from setup in this fragment or section; alternatives branch from the same base.
const revised = program.editViolinPlot({
  target: "violins",
  data: "revised",
  x: "value",
  y: "category",
  split: false,
  density: { bandwidth: 1.1 }
});
Use density: { weight: false } in editViolinPlot to return to unweighted
profiles. Omitting weight preserves the current mode.
The owner ID stays stable while the action creates a new immutable density-data revision and reconciles orientation, scales, axes, grid, selections, and highlights. Use the lower actions for a single resource decision:
Contextual fragment. Use an ES module with the imports, data, and prepared resource state described in this section. Resolve these names from setup in this fragment or section; alternatives branch from the same base.
const revised = program
  .editDensity({
    bandwidth: 1.1,
    placement: {
      type: "category",
      width: { band: 0.6, resolve: "shared" }
    }
  })
  .editAreaMark({ opacity: 0.55 });
editAreaMark continues to own path appearance. Canvas, scale, data,
filtering, selection, highlighting, and facet changes rematerialize the
complete density paths.
Current boundary
- Exactly one categorical and one quantitative position role
- At most two split values
- Cartesian coordinates only
- No raincloud raw-point/box components, adaptive bandwidth, or Polar violin
Related
Violin recipe · Density encoding · Area marks · Box plots
Documentation provenance
293 actions · sha256:e755591a2e5f5e2b494867583876e28020a478c5220b77bdc6ad469a6224891d