Published-release documentation · release compatibility
Violin Plot Recipe
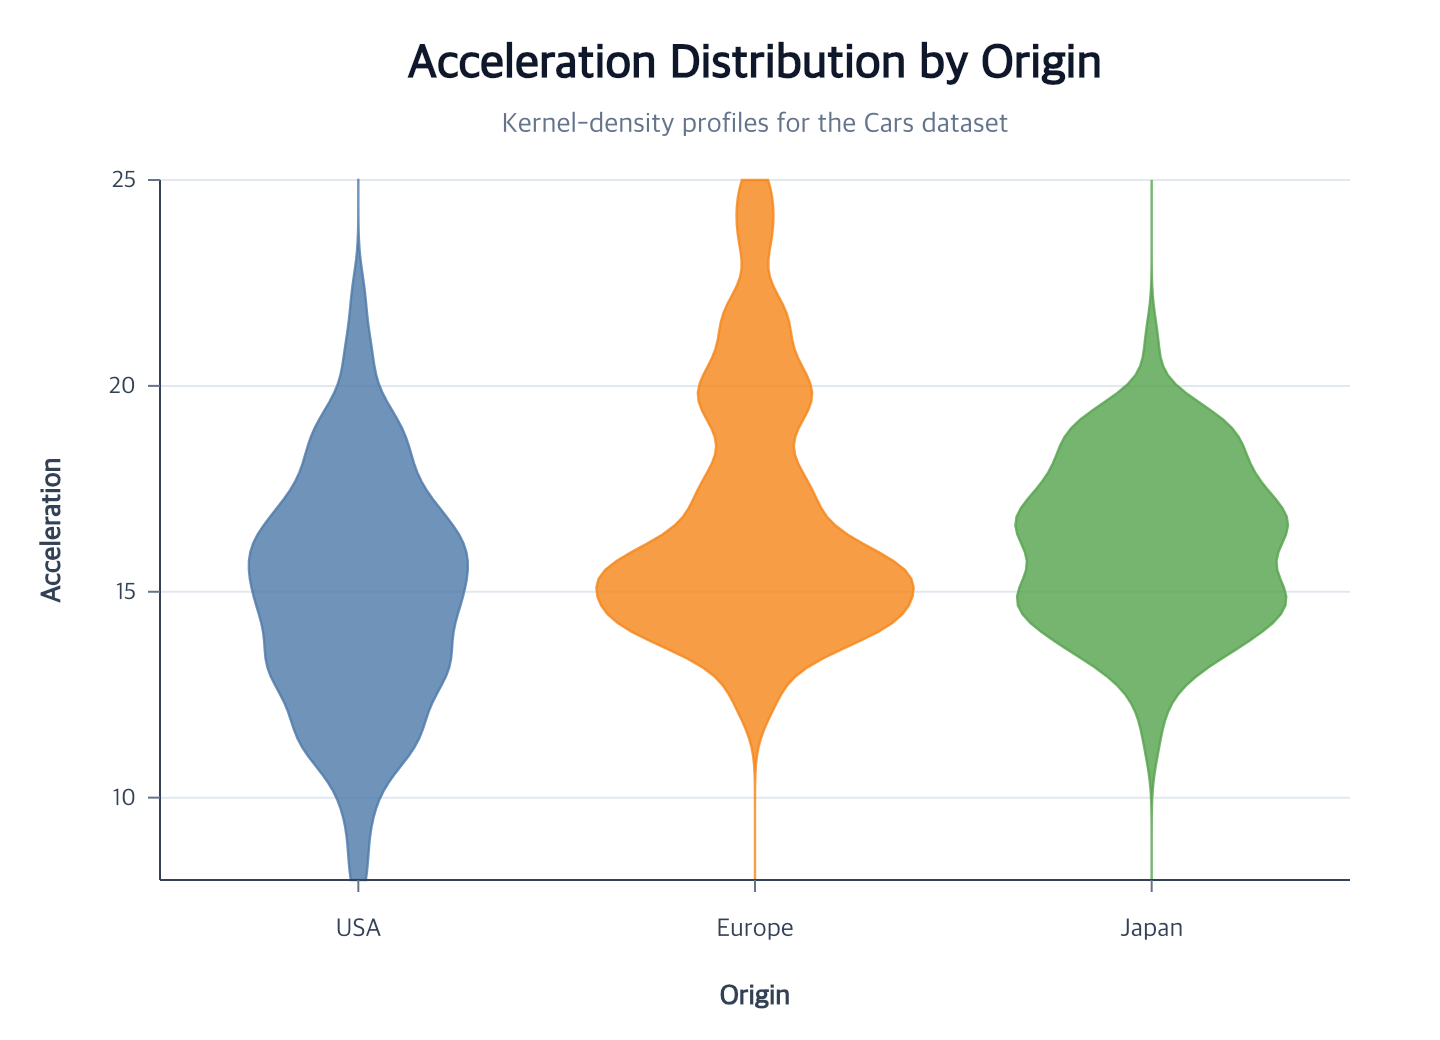
Minimal flow
Runnable: install ggaction and provide the named data array as plain row objects.
import { chart } from "ggaction";

const program = chart()
  .createCanvas()
  .createData({ values })
  .createViolinPlot({
    x: "category",
    y: "value"
  });
You must decide
- One categorical field and one quantitative field
- Whether the category belongs on x or y
- Whether to compare full profiles or two split halves
The library infers
- The current dataset and Cartesian coordinate
- Field types when the stored values determine them unambiguously
- Gaussian unit density, automatic bandwidth and extent, and 100 sample steps
- Category band and quantitative value scales
- Shared
0.8band-relative width, closed paths, axes, and horizontal grid
Add color: "category" for category fills. Use split: { field } when the
field has exactly two values, or provide an explicit two-value domain when
side assignment must be stable independently of source order.
Continue
Violin-plot API · Density encoding · Scale options
Documentation provenance
293 actions · sha256:e755591a2e5f5e2b494867583876e28020a478c5220b77bdc6ad469a6224891d