Published-release documentation · release compatibility
Marks
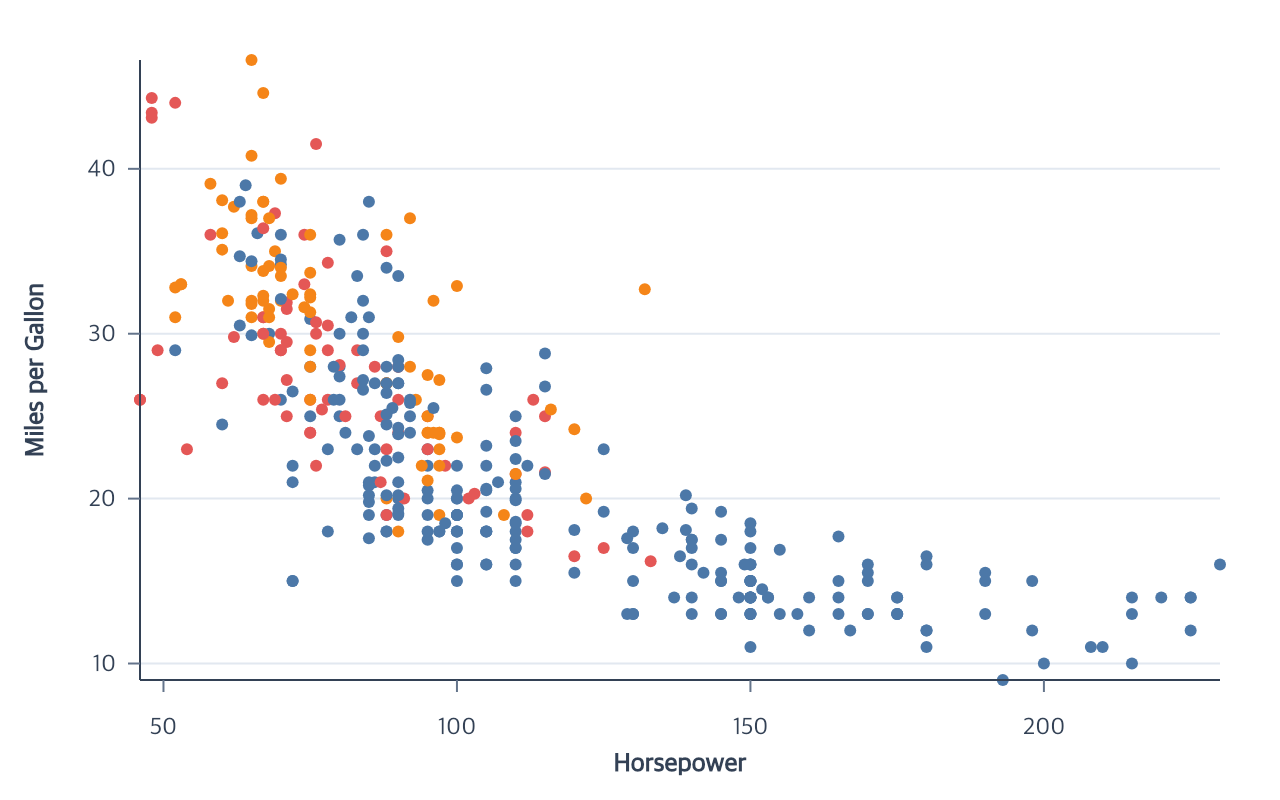
Marks define the semantic form of a layer. Create a mark first, then connect it to data through position, grouping, and appearance encodings. The first mark of each type infers its ID and current dataset when those choices are unambiguous.
Clip one layer to its plot
Point, Line, Area, Bar, Rect, Rule, Text and Tick create/edit actions accept
clip: true. It hides only the part of that mark outside its Cartesian plot.
Raw data, coordinates, scales and glyph sizes remain unchanged; axes, legends
and other layers keep their own placement. Omission preserves an edit’s current
setting, and clip: false disables it. Polar/Parallel clipping is unsupported.
This complete module first creates a scatterplot, then refines its existing mark:
Contextual fragment. Use an ES module with the imports, data, and prepared resource state described in this section. Resolve these names from setup in this fragment or section; alternatives branch from the same base.
import { chart } from "ggaction";

const program = chart()
  .createCanvas({ width: 480, height: 320, margin: 60 })
  .createData({ values: [{ x: -1, y: 3 }, { x: 2, y: 7 }] })
  .createScatterPlot({ x: { field: "x", scale: { domain: [0, 10] } }, y: "y" })
  .editPointMark({ clip: true });
You may also set point: { clip: true } in createScatterPlot.
Other Cartesian facades forward their declared nested mark styles in the same way.
A source mark’s clip is not automatically inherited by attached text labels.
See the mark action reference for exact signatures.
Choose a mark family
At a glance
| Family | Create | Edit | Initial graphic |
|---|---|---|---|
| Point | createPointMark |
editPointMark, jitterPoints, removeJitter |
Point collection |
| Line | createLineMark |
editLineMark |
Path collection |
| Area | createAreaMark |
editAreaMark |
Closed path collection |
| Arc | createArcMark |
editArcMark |
Closed sector path collection |
| Bar | createBarMark |
editBarMark |
Rect collection |
| Reference line / band | createReferenceLine / createReferenceBand |
Rule/Rect and position encodings | Line/Rect collection |
| Rule | createRuleMark |
Encoding actions | Line collection |
| Tick | createTickMark |
editTickMark |
Centered line collection |
| Text | createTextMark |
editTextMark, layoutLabels, removeLabelLayout, removeMarkLabels |
Text collection |
| Rect | createRectMark |
editRectMark |
Rect collection |
Point, Bar, Rect, Tick, Rule, and row-backed Text marks accept
missing: "error" | "skip" in their create and edit actions. The explicit
"error" policy rejects the first null, absent, or undefined value in any
field-backed active encoding. "skip" removes that row from every scale domain
and concrete item calculation for the mark, so its selections, labels, and
inspection counts use the same eligible set. Omission preserves the earlier
per-mark behavior. Area keeps its separate "error" | "break" series policy;
Arc missing values must be handled by the data or aggregate policy.
Use removeMark({ target? }) to remove one complete stable mark owner. It also
removes generated composite children, unreferenced generated datasets, owned
legends, and selection/highlight state. Source data and resources shared by
another mark remain:
Contextual fragment. Use an ES module with the imports, data, and prepared resource state described in this section. Caller-provided receivers:
layeredProgram. Resource selectors used here:target: "points". Resolve these names from setup in this fragment or section; alternatives branch from the same base.
const barsOnly = layeredProgram.removeMark({ target: "points" });
Generated children such as regression lines cannot be removed directly; select their stable owner instead.
Creation establishes semantic ownership but may leave an empty collection. Concrete graphics appear when the required encodings make the mark renderable. Later Canvas, scale, grouping, or appearance edits explicitly rematerialize those graphics.
Shared inference
datadefaults to the current dataset.- The first omitted mark ID uses the semantic role:
"point","line","area","arc","bar","rect","rule","tick", or"text". - A second mark of the same type requires an explicit ID.
- A newly layered mark can inherit compatible data, coordinate, x, and y encodings from the current layer, or one unique source on the current dataset.
- A grain-preserving aggregate is inherited when both mark recipes support the same result. For example, a line added after mean bars inherits that mean.
- Bin, stack, offset, and appearance policies are not copied into a mark recipe that does not support the same final item grain.
- Only field-based positions compatible with the new mark and existing scale type are inherited. Incompatible channels remain unencoded.
- Passing
dataexplicitly starts independent mark assembly and disables layered position inheritance.
Tick marks
createTickMark({ id?, data?, missing?, length?, stroke?, strokeWidth?, opacity?, lineCap?, lineJoin?, miterLimit? } = {})
creates a Tick, and
editTickMark({ target?, length?, stroke?, strokeWidth?, opacity?, lineCap?, lineJoin?, miterLimit? })
updates it.
createTickMark creates a centered fixed-length line glyph for every source
row after both x and y encodings are complete:
Contextual fragment. Use an ES module with the imports, data, and prepared resource state described in this section. Caller-provided receivers:
cars. Resource selectors used here:target: "ticks". Resolve these names from setup in this fragment or section; alternatives branch from the same base.
const rug = chart()
  .createCanvas({ width: 800, height: 240 })
  .createData({
    id: "cars",
    values: cars.map(car => ({ ...car, Baseline: 0 }))
  })
  .createTickMark({
    id: "ticks",
    length: 14,
    stroke: "#2563eb",
    strokeWidth: 1.5,
    opacity: 0.3
  })
  .encodeX({ target: "ticks", field: "Horsepower" })
  .encodeY({ target: "ticks", field: "Baseline" });
The default length is 14, stroke width is 2, opacity is 1, and stroke
uses the theme mark color. editTickMark partially edits those values.
Tick cap/join/miter options follow the shared
Mark Style
contract.
Incomplete x or y is retained semantically without fabricated geometry.
Fixed-y rug plots use an explicit y field; x-only plot-edge placement is not
inferred.
Add a direct constant or quantitative-field direction with encodeAngle.
Zero degrees is vertical/up and positive values rotate clockwise; Tick length
and center remain fixed. removeEncoding({ channel: "angle" }) restores the
unrotated baseline.
Point, Bar, and Rect creation and editing accept stroke: false to disable the
outline and set its width to zero. Scatter point.stroke and Bar/Histogram
bar.stroke pass this option through to their mark owners. Restoring a color
with the corresponding edit action enables an outline again.
Related
Encodings · Statistical layers · Complete action reference
Documentation provenance
293 actions · sha256:e755591a2e5f5e2b494867583876e28020a478c5220b77bdc6ad469a6224891d