Published-release documentation · 281 actions; release compatibility · contract 5520b0fa9525
Choose the Right Authoring Level
A chart can begin as one high-level action and remain editable through its lower-level parts. You choose the size of the decision at each step: the whole chart, a statistical layer, one encoding, a guide, or concrete graphics in an extension.
Prerequisites
Use the Getting Started browser module, the full package, and
<canvas id="chart"></canvas>. The complete program includes all three input rows.
Complete program
import { chart, hconcat } from "ggaction";
import { render } from "ggaction";

export function authoringStages() {
  const base = chart()
    .createCanvas({ width: 400, height: 300, margin: 65 })
    .createData({ id: "observations", values: [
      { x: 1, y: 3 }, { x: 2, y: 5 }, { x: 3, y: 4 }
    ] });
  const highLevel = base.createScatterPlot({ id: "points", x: "x", y: "y", guides: false });
  const composed = base.createPointMark({ id: "points" })
    .encodeX({ field: "x" }).encodeY({ field: "y" });
  const styled = highLevel.encodePointRadius({ value: 8 })
    .editPointMark({ fill: "#7c3aed", opacity: 0.35 })
    .createGuides({ legend: false });
  const revisedAgain = styled.editPointMark({ opacity: 0.7 });
  return { highLevel, composed, styled, revisedAgain };
}

export function createHierarchicalAuthoring() {
  const { highLevel, styled, revisedAgain } = authoringStages();
  return hconcat({ programs: [
    highLevel.createTitle({ text: "High-level chart" }),
    styled.createTitle({ text: "Focused refinement" }),
    revisedAgain.createTitle({ text: "Later opacity edit" })
  ], gap: 20 });
}

const program = createHierarchicalAuthoring();
render(program, document.querySelector("#chart").getContext("2d"));
Refine the chart you already authored
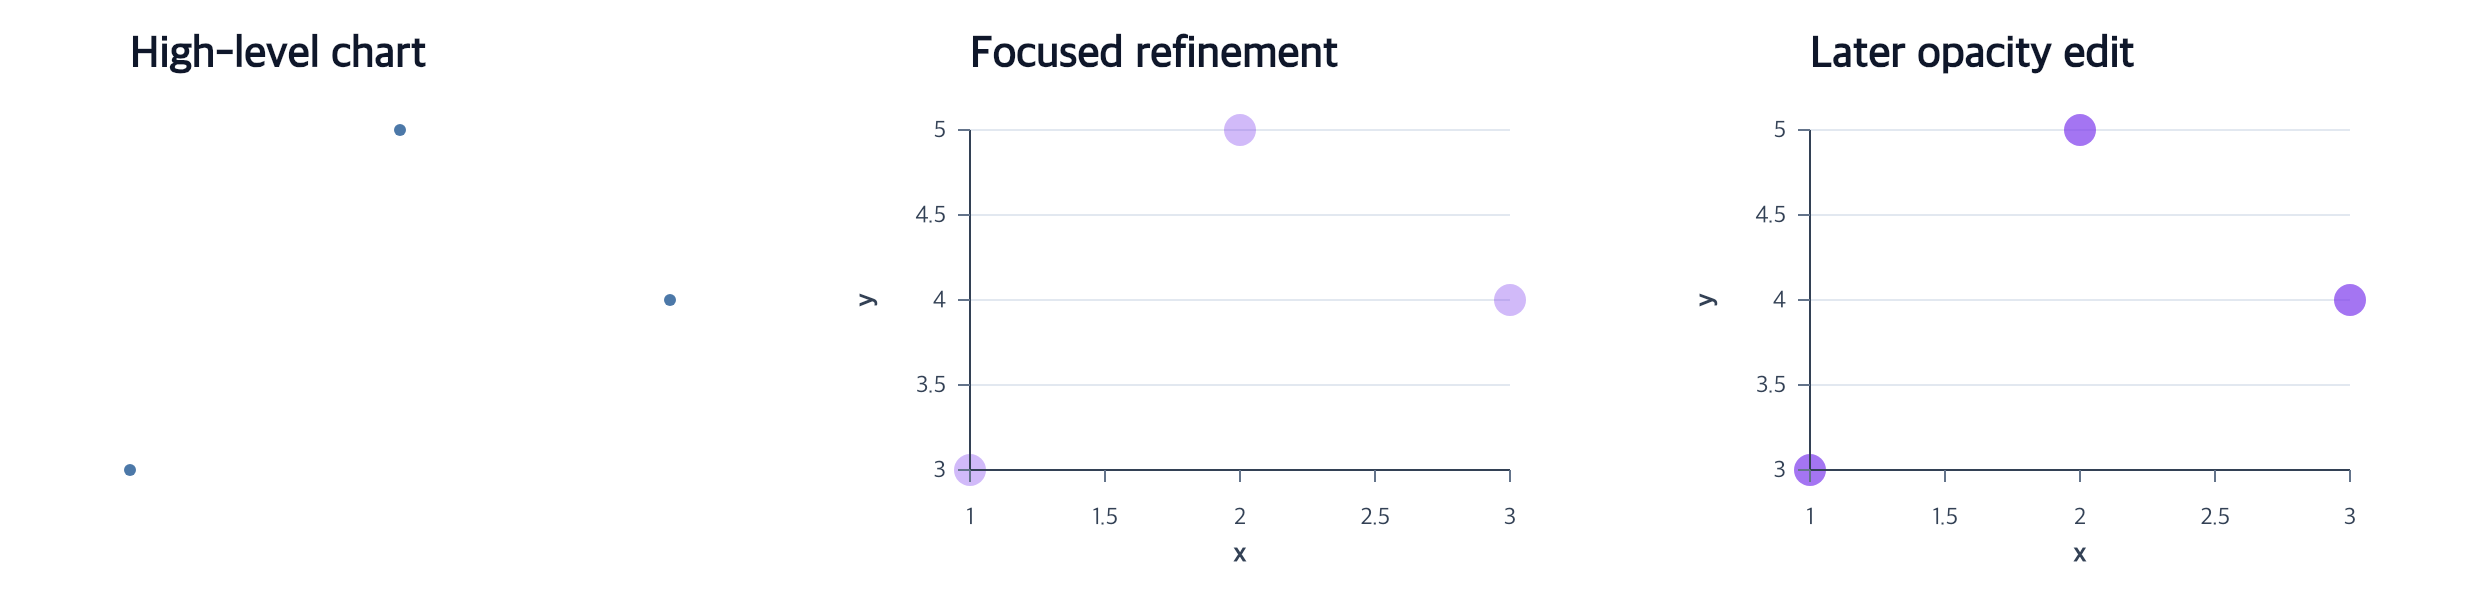
The first panel is highLevel, created by one createScatterPlot action.
The second is styled, derived directly from that program by changing point
radius, fill, and opacity and adding guides. The third is revisedAgain: one
more point-opacity edit changes 0.35 to 0.7. The earlier panels retain their
own values. Neither revision repeats the dataset or positional decisions.
Appending an edit preserves when a design decision changed. Authoring the same final style in the initial constructor can produce the same graphics, but its trace records an initial choice instead of a later revision. Repeated edits of this point-opacity property use the latest value; other owners, including theme and field encodings, keep their documented compatibility and precedence rules.
composed is a separate construction alternative: createPointMark, encodeX,
and encodeY produce the same initial graphics as highLevel. It is included
to compare abstraction choices; refinement does not require expanding the
high-level call into that lower-level program.
Follow the relative action hierarchy
The grammar has two units: graphical actions and chart programs. Within a program, an action’s abstraction level is relative to the decisions it composes. For example, an entire guide collection contains axes; an axis contains a line, ticks, labels, and a title. These relationships have several levels even when the catalog gives the actions the same role tag.
createGuides
└─ createAxes
   └─ createXAxis
      └─ createXAxisTicksAndLabels
         └─ createXAxisTicks
            └─ editXAxisTicks
This is one branch of the hierarchy, not the complete guide implementation. A whole-axis choice can delegate to tick choices, while an author who only wants longer ticks can call the focused editor.
Read the delegation in the trace
The authored sequence is linear; delegated calls form the nested trace. For the first panel, part of the tree is:
createScatterPlot
├─ createPointMark
│  ├─ editSemantic
│  └─ createGraphics
├─ encodeX
└─ encodeY
Nested style, scale, and materialization calls are omitted here for readability.
Inspect authoringStages().highLevel.trace for the retained tree. In styled,
that whole top-level createScatterPlot call remains before the new refinement
calls. Renderers draw the resulting graphicSpec; they do not execute the trace.
The extension primitives express semantic and concrete graphical transitions. Changing a primitive graphic directly does not revise the domain intent, so later rematerialization may rebuild it. Ordinary revisions should use the domain action that owns the decision and its update policy.
Catalog role tags
The repository also labels actions with H0–H4 for catalog lookup. These tags group actions by role independently of their trace depth. Several actions along the guide hierarchy above all have tag H3. An action may have several tags, and a call may skip tags when it delegates.
| Tag | Catalog grouping | Examples |
|---|---|---|
| H0 | Complete charts and repeated/composed chart structure | createScatterPlot, createHistogram, facet |
| H1 | Statistical or composite tasks | createSummaryData, createECDFData, createMarkLabels |
| H2 | Marks, encodings, scales, coordinates, bindings | createPointMark, encodeX, editScale, bindMarkData |
| H3 | Presentation and guide components | editPointMark, createAxes, editXAxisTicks, applyTheme |
| H4 | Extension primitives | editSemantic, createGraphics, editGraphics |
Role tags, API layers, and packages answer different questions. API layers label an action as user-facing, advanced, or primitive. Package membership determines whether a method is exposed by the full, basic, or extension entry. A role tag alone does not determine either. The exact reference records current classifications; use the action relationships to understand composition.
Related
Action design principles · Authoring conventions · Action traces · Choose a chart