Published-release documentation · 281 actions; release compatibility · contract 5520b0fa9525
Empirical Cumulative Distribution Plots
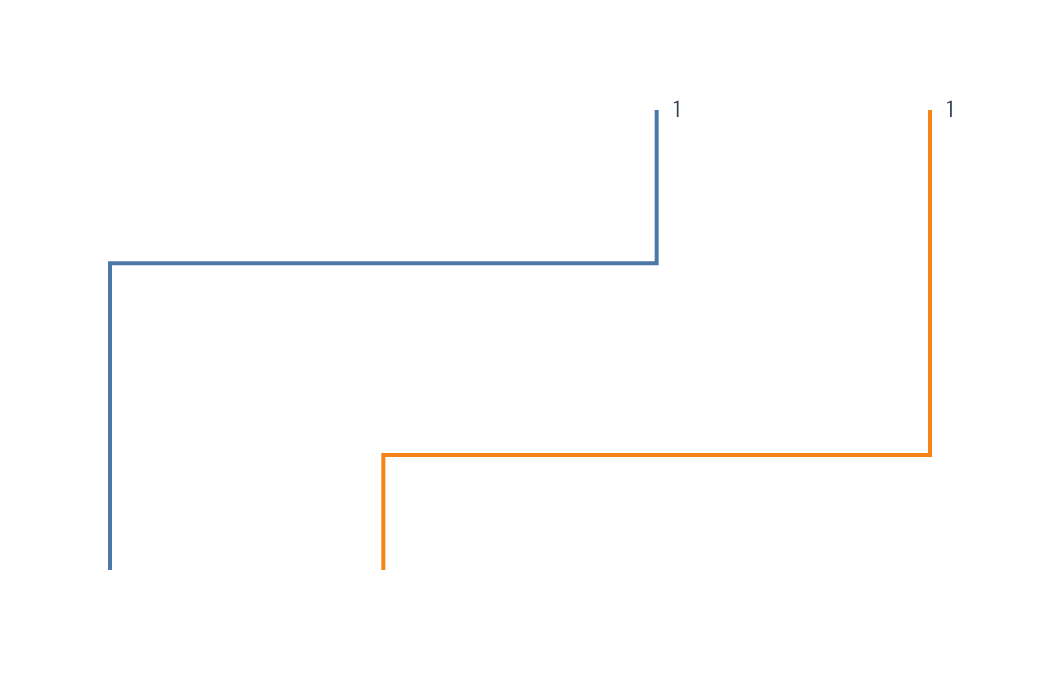
An empirical cumulative distribution function answers: “What share of the
observations is less than or equal to this value?” createECDFPlot owns that
statistical definition and expresses the result with ordinary derived data,
Line, encoding, label, scale, and guide actions.
Build a grouped weighted ECDF
import { chart, render } from "ggaction";

const values = [
  { group: "A", value: 1, weight: 2 },
  { group: "B", value: 2, weight: 1 },
  { group: "A", value: 3, weight: 1 },
  { group: "B", value: 4, weight: 3 }
];

const program = chart()
  .createCanvas({ width: 520, height: 340, margin: 55 })
  .createData({ id: "data", values })
  .createECDFPlot({
    id: "ecdf",
    field: "value",
    groupBy: "group",
    weight: "weight",
    color: "group",
    labels: { dx: 10 },
    guides: false
  });

render(program, document.querySelector("#chart").getContext("2d"));
The runnable repository version is in
examples/ecdf-plot.
This example uses colored paths and endpoint labels without axes or a legend,
matching the repository program and image. To add a legend, reserve space on
its chosen edge before creating guides; the 55-pixel margin is for this
guide-free example. Use a browser module with a <canvas id="chart"></canvas>.
How the step data is defined
For unweighted values [1, 1, 2, 4], the materialized rows represent:
| Support | Cumulative count | Probability |
|---|---|---|
| 1 | 0 | 0 |
| 1 | 2 | 0.5 |
| 2 | 3 | 0.75 |
| 4 | 4 | 1 |
The first row seeds the lower end of the first jump. The Line uses
curve: "step-after", so the visible jump at each support is the
right-continuous definition F(x) = P(X <= x). Equal observations share one
jump instead of depending on source row order.
Grouping computes a separate denominator and path for each group. With
weight, the denominator is the sum of positive finite weights. Zero-weight
rows add neither mass nor support. Negative weights and a zero denominator are
errors.
Reuse the derived rows
Use createECDFData when another chart or annotation should consume the same
statistics:
const dataOnly = chart()
  .createData({ id: "data", values })
  .createECDFData({
    id: "distribution",
    field: "value",
    groupBy: "group",
    weight: "weight",
    as: { value: "support", cumulative: "mass", probability: "share" }
  });
The immutable transform records the source field, grouping, weight and missing policies, output fields, and resolved denominator for every group.
Missing values and grouping
missing defaults to "drop". It omits a row whose value, weight, or group
field is invalid. Use missing: "error" when incomplete input should stop the
action. A negative weight remains an error under both policies.
Color does not create statistical groups. If color uses a field, include
that field in groupBy; this keeps appearance from silently changing the
denominator.
Revise the statistical source
Filter raw observations first, then point the ECDF owner at that derived source:
const revised = program
  .filterData({
    id: "positive",
    source: "data",
    field: "value",
    predicate: { op: "gt", value: 1 }
  })
  .editECDFPlot({ target: "ecdf", data: "positive" });
The edit recalculates denominators and steps, then rebuilds the path, endpoint
labels, and guides while retaining the stored appearance policy. Use
groupBy: false to remove grouping or weight: false to return to sample
counts. Ungrouping removes a coupled group color; color: false removes it
explicitly during another role edit. Line appearance, labels, scales, and guides remain editable through
their ordinary lower-level actions.