Published-release documentation · release compatibility
Basic Charts
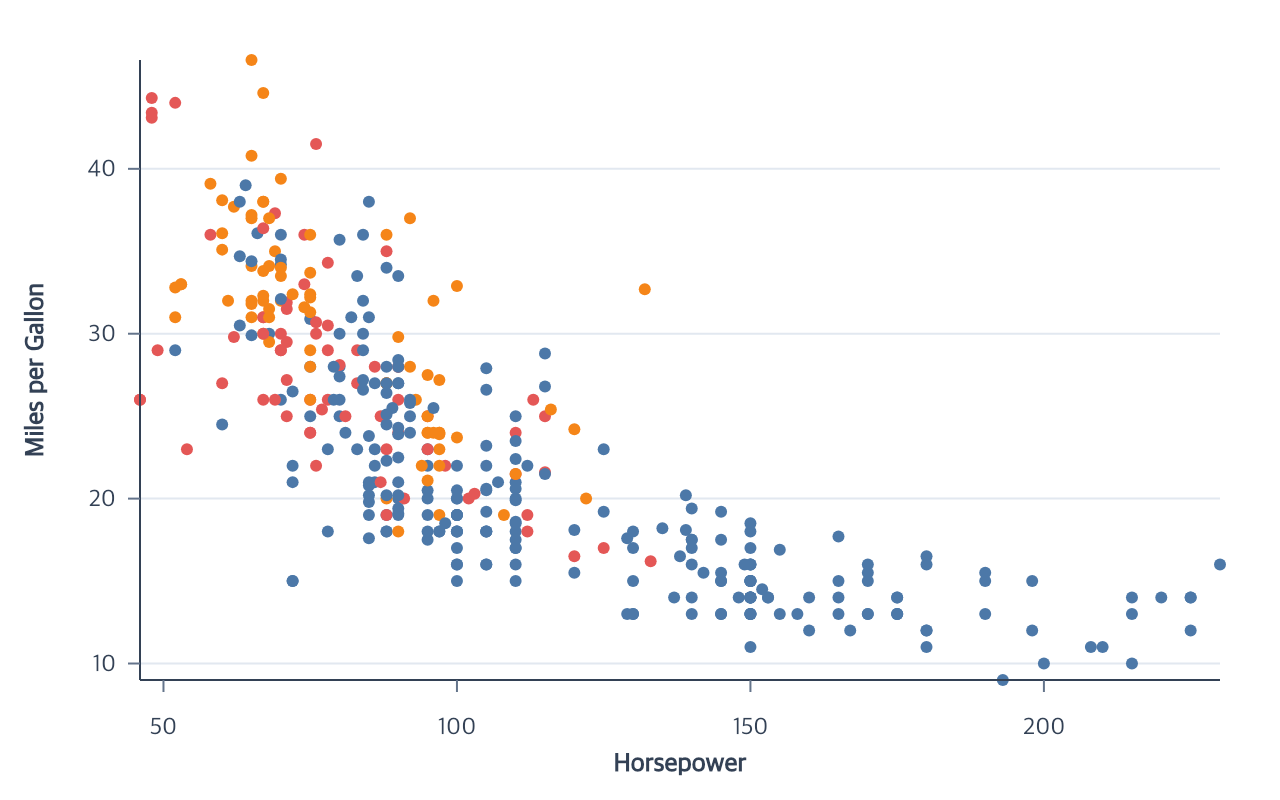
Basic chart actions create a complete mark, its encodings, and applicable guides in one traceable call. Create a Canvas and dataset first, then provide only the fields that define the chart.
Contextual fragment. Use an ES module with the imports, data, and prepared resource state described in this section. Resolve these names from setup in this fragment or section; alternatives branch from the same base.
const program = chart()
  .createCanvas()
  .createData({ values })
  .createScatterPlot({ x: "horsepower", y: "mpg", color: "origin" });
These actions are conveniences over the regular mark, encoding, and guide actions. They call those wrapped actions as trace children; they do not add a second chart specification or compile semantics during rendering.
Their existing nested mark styles accept the same shape details as direct
marks: Point, Line, Area, Arc, Rule, and Tick styles accept lineCap,
lineJoin, and miterLimit; Bar and Rect styles also accept cornerRadius.
See Mark Style.
This page covers six common Cartesian facades. Use Choose a Chart for all H0 chart families and their package and editing paths.
Choose a facade
| Facade | Shortest complete decision | Guides when omitted |
|---|---|---|
createScatterPlot |
{ x, y } |
applicable guides |
createTextPlot (Full only) |
{ x, y, text } |
applicable guides |
createLinePlot |
{ x, y } |
applicable guides |
createBarPlot |
{ x, y } |
applicable guides |
createHistogram |
{ field } |
applicable guides |
createHeatmap |
{ x, y }, or { x, y, bin: {} } |
applicable guides |
These facades create a complete common Cartesian chart from fields. After
creation, editing returns to the action that owns the decision; for example,
use encodeY, editScale, editBarMark, or editLegend rather than a generic
facade editor.
The Basic package entry
ggaction/basic keeps its smaller creation API. Its available field encodings
can be called again to replace settings on an existing scale of the same type;
all dependent marks and guides are validated and updated together. It does not
expose the Full editScale, focused scale editors, or legend editors. Use Full
for scale-type transitions, or create a new scale ID in Basic. See
Encoding reassignment.
Shared behavior
datais optional when there is a current dataset or exactly one dataset. Pass it explicitly when more than one dataset could apply.idis optional for the first chart of each family. A stable default role is used; a conflicting role requires an explicit ID.- A field may be a string or an encoding option object. Use the object form for field types, scales, aggregates, and other channel-specific options.
guidesis optional. Omission or{}reuses compatible guides and creates missing components for this facade’s layer. Axes and grids must use the same coordinate and scale IDs; legends must also match channels, domain order, and symbol recipe. Existing titles and styles are retained. Conflicting explicit guide styles require the owning editor or a disabled guide branch.guides: falseand nestedfalseskip this call’s requests; they do not delete existing guides. AutomaticcreateGuides()also keeps existing collections and creates missing applicable collections. An explicit collection object retains its child action’s strict create contract; use the owning editor to revise it. See guide creation and reuse.- Facade guides describe the facade’s own layer and coordinate. Cartesian facades accept Cartesian axes and grids. Line and Parallel legends accept line symbols or explicit symbol layers; Histogram and Violin legends are categorical. Box plots have no owned appearance legend. Use the lower guide actions to describe another layer. Heatmap interval-color legends are currently unsupported.
- A facade validates its complete option object before changing the program.
- To revise the result, use the resource action that owns the decision, such as
encodeX,editScale,editPointMark, oreditLegend. AggregateeditScatterPlot-style actions are intentionally not provided.
Canvas and source data remain separate authoring decisions. Basic chart actions never create either one or silently choose among ambiguous resources.
createScatterPlot
createScatterPlot(options: CreateScatterPlotOptions): ChartProgram
Required options are x and y. Optional color, stroke, size, and shape values
create field encodings; point controls constant point appearance.
Contextual fragment. Use an ES module with the imports, data, and prepared resource state described in this section. Resolve these names from setup in this fragment or section; alternatives branch from the same base.
const scatter = chart()
  .createCanvas()
  .createData({ values: cars })
  .createScatterPlot({
    x: "Horsepower",
    y: "Miles_per_Gallon",
    color: "Origin",
    point: { opacity: 0.7 },
    guides: {
      axes: {
        x: { title: { text: "Horsepower" } },
        y: { title: { text: "Miles per gallon" } }
      }
    }
  });
The stable default mark ID is scatterPlot. Omitted size materializes the
default point radius of 3. point.radius accepts a non-negative finite logical
radius, including zero, and conflicts with size. It delegates to
encodePointRadius → encodeRadius in default and Basic entries. Constant fill,
shape, opacity, stroke, and stroke width belong in point; field-driven color,
stroke, size, and shape remain top-level.
Use stroke: "Origin" to encode a field as the point outline; its object form
accepts field-driven encodeStroke options. It conflicts with point.stroke.
A requested point.strokeWidth is applied after the stroke encoding. Categorical,
continuous, and discretized stroke legends use the existing guide policy in both
default and Basic entries; select guides.legend.channels when authoring multiple
appearance channels. Basic supports this through the facade, without exposing
a standalone encodeStroke method.
createLinePlot
createLinePlot(options: CreateLinePlotOptions): ChartProgram
Required options are x and y. groupBy accepts a field name or a non-empty
unique tuple such as ["country", "scenario"]. Explicit groups define identity;
color and strokeDash can use other fields with one value per series. Without
groupBy, color/dash retain their shared-field grouping. Use line for constant
appearance. See independent series identity.
For a direct quantitative/temporal line, line: { missing: "break" } preserves
null/absent observations as gaps. The default remains strict. See
gaps in direct lines for supported
positions, ordering, domains and segment ownership.
Contextual fragment. Use an ES module with the imports, data, and prepared resource state described in this section. Resolve these names from setup in this fragment or section; alternatives branch from the same base.
const line = chart()
  .createCanvas({ margin: { right: 140 } })
  .createData({ values: rows })
  .createLinePlot({
    x: { field: "date", fieldType: "temporal" },
    y: { field: "value", aggregate: "mean" },
    color: "group",
    strokeDash: { field: "group" },
    line: { curve: "monotone", strokeWidth: 3 }
  });
The stable default mark ID is linePlot. A plain strokeDash string is not
accepted because it could mean either a field or a named dash style; use
{ field } or { value }. This facade creates Cartesian lines. Use the
explicit Polar mark and encoding actions for closed Polar paths. A field
materialized by createWindowData can be used directly as the quantitative y
position without applying another aggregate.
Line y positions use quantitative or temporal scales, so
guides.grid.horizontal does not accept bandPosition. A categorical x with
scale: { type: "band" } can use guides.grid.vertical.bandPosition set to
"center" or "boundary". Facade grids belong to the line’s own position
scales; an unrelated band scale cannot replace its y scale.
For named x categories, set fieldType: "ordinal" or "nominal" and optionally
provide scale.domain for their order. Point/band centers align with companion
marks. See ordered categories for
duplicates, observed gaps, grouping, and raw versus aggregate values.
createBarPlot
createBarPlot(options: CreateBarPlotOptions): ChartProgram
Required options are x and y. Position option objects select vertical,
horizontal, aggregate, or ranged geometry. color.layout owns grouped,
stacked, normalized-fill, overlay, and diverging arrangements.
Use { lower, upper } on one axis for raw interval bars. The opposite axis
may be categorical, temporal, or numeric. Bounds remain per-row values: no mean, sum,
or stacking is introduced. Do not combine a range with field, aggregate,
or stack in the same channel, or specify ranges on both axes.
Two raw numeric fields create one bar per row at the actual numeric center.
Use createBarPlot({ x: "position", y: "value", width: { pixels: 20 } })
for vertical bars, or add orientation: "horizontal" for horizontal bars.
Width defaults to 5 pixels. Numeric ranges infer orientation from their measure
channel. Numeric bars preserve repeated centers and allow overlay layout only.
Contextual fragment. Use an ES module with the imports, data, and prepared resource state described in this section. Resolve these names from setup in this fragment or section; alternatives branch from the same base.
import { chart } from "ggaction";
const program = chart().createCanvas({ width: 400, height: 300, margin: 60 })
  .createData({ values: [{ item: "A", low: 2, high: 6 }, { item: "B", low: 4, high: 8 }] })
  .createBarPlot({ x: { lower: "low", upper: "high" }, y: "item", width: { pixels: 18 } });
A range channel also accepts fieldType: "quantitative" and an explicit scale,
using the existing bar scale types (linear, pow, sqrt, or symlog).
Swap x and y for vertical bars. Repeated categories remain separate rectangles.
Layered interval bars can share a compatible value scale with a raw line;
use explicit scale IDs when the plot contains several scales.
Field strings use data-driven shorthand: finite numeric fields infer
quantitative positions and other supported scalar fields infer nominal
positions. Use an option object with fieldType when a numeric field is an
ordinal category or when a field is temporal.
Both { x: "product", y: "units_sold" } and the horizontal
{ x: "units_sold", y: "product" } infer the measure’s mean per category.
Set aggregate explicitly for another statistic. Temporal categories work
on either axis and accept temporal scale options.
Contextual fragment. Use an ES module with the imports, data, and prepared resource state described in this section. Resolve these names from setup in this fragment or section; alternatives branch from the same base.
const bars = chart()
  .createCanvas()
  .createData({ values: rows })
  .createBarPlot({ x: "product", y: "units_sold" });
Contextual fragment. Use an ES module with the imports, data, and prepared resource state described in this section. Resolve these names from setup in this fragment or section; alternatives branch from the same base.
const bars = chart()
  .createCanvas({ margin: { right: 140 } })
  .createData({ values: rows })
  .createBarPlot({
    x: { field: "year", fieldType: "ordinal" },
    y: { field: "value", aggregate: "mean" },
    color: { field: "group", layout: "group" },
    width: { band: 0.72 }
  });
The stable default mark ID is barPlot. width accepts the same band or
logical-pixel options as encodeBarWidth; bar controls constant fill,
opacity, stroke, and stroke width.
For interval-width bars with a separate Y measure, use createBarPlot with x.bin and y.aggregate; see bins with a separate measure.
createHistogram
createHistogram(options: CreateHistogramOptions): ChartProgram
field is required. The action atomically creates binned x and count y
encodings because those meanings depend on each other.
Contextual fragment. Use an ES module with the imports, data, and prepared resource state described in this section. Resolve these names from setup in this fragment or section; alternatives branch from the same base.
const histogram = chart()
  .createCanvas({ margin: { right: 140 } })
  .createData({ values })
  .createHistogram({
    field: "value",
    maxBins: 10,
    color: { field: "group", layout: "stack" }
  });
The stable default mark ID is histogram. The default is maxBins: 10.
Choose exactly one of maxBins, binStep, or binBoundaries. Optional
xScale, yScale, stack, color, and bar values use the corresponding
histogram, color, and bar contracts.
Both histogram position axes use continuous scales: x represents bin extents and
y represents count or stacked mass. Grid count and explicit values remain
available; categorical bandPosition is unavailable in both directions.
createHeatmap
createHeatmap(options: CreateHeatmapOptions): ChartProgram
createHeatmap supports two explicit modes. Without bin, x and y describe pre-gridded rows and the action creates
one cell for each valid observed row. color is optional; omit it to declare the
cell layout first, then assign a field with encodeColor. With bin, raw quantitative x and y fields are divided into a
rectangular grid and cell color represents the generated count.
Contextual fragment. Use an ES module with the imports, data, and prepared resource state described in this section. Resolve these names from setup in this fragment or section; alternatives branch from the same base.
const heatmap = chart()
  .createCanvas({ margin: { right: 120 } })
  .createData({ values: cells })
  .createHeatmap({
    x: { field: "year", fieldType: "ordinal" },
    y: { field: "country", fieldType: "nominal" },
    color: {
      field: "life_expectancy",
      fieldType: "quantitative",
      scale: { type: "sequential", palette: "viridis" }
    },
    rect: { stroke: "white", strokeWidth: 1 }
  });
Contextual fragment. Use an ES module with the imports, data, and prepared resource state described in this section. Resolve these names from setup in this fragment or section; alternatives branch from the same base.
const binnedHeatmap = chart()
  .createCanvas({
    width: 700,
    height: 500,
    margin: { top: 70, right: 140, bottom: 75, left: 85 }
  })
  .createData({ values: cars })
  .createHeatmap({
    x: "Weight_in_lbs",
    y: "Miles_per_Gallon",
    bin: {
      bins: { x: 10, y: 8 },
      extent: { x: [1500, 5200], y: [8, 48] }
    },
    color: { scale: { palette: "blues" } },
    rect: { stroke: "white", strokeWidth: 1 }
  });
The binned mode uses 10 × 10 bins by default. Its includeEmpty default is
true, so the complete rectangular grid is visible; set it to false to emit
only occupied cells. An omitted per-axis extent is inferred from finite x/y
values. Explicit extents must contain every eligible value. Position scale
domains default to the resolved bin extents, while an explicit position scale
option takes precedence. color is optional in binned mode and may configure
the generated quantitative count scale, but cannot supply another field.
Binned bin.assignment accepts "edges" (default) or "step"; the
2D-bin assignment contract defines their boundary behavior.
The high-level and explicit data-action paths store the same policy.
The stable default mark ID is heatmap. Binned mode owns a namespaced derived
dataset and records createBin2DData as a wrapped child action. Default guide
titles use the original x/y field names and Count, never generated field
names. Automatic chart grid lines are disabled because the ranged cells already
form a grid; pass an explicit guides.grid option to enable them.
In both modes, the color encoding is the sole cell fill owner, so rect.fill
is rejected; rect accepts opacity and outline options. Text is not automatic.
Add it afterward with
createTextMark().encodeText() when the rows contain display values.
For direct control over the derived rows, use
createBin2DData before authoring the ranged rect layer.
Other complete chart facades
- Parallel coordinates creates row-wise paths across independently scaled dimensions.
- Box plots, gradient plots, and violin plots summarize category distributions.
- Regression, error bars, and error bands add statistical or interval layers.
Advanced authoring
Use individual mark, encoding, coordinate, and guide actions when the chart needs custom layering, Polar geometry, a partially constructed state, or control between the wrapped steps. Both authoring styles produce the same immutable semantic and graphical resources.
createTextPlot
Create one independent text mark per data row, without aggregation:
Contextual fragment. Use an ES module with the imports, data, and prepared resource state described in this section. Resolve these names from setup in this fragment or section; alternatives branch from the same base.
import { chart } from "ggaction";

const textChart = chart().createCanvas().createData({ values: [
  { x: 1, y: 2, label: "First" }, { x: 2, y: 3, label: "Second" }
] }).createTextPlot({ x: "x", y: "y", text: "label" });
The full entry exposes this facade; ggaction/basic does not. Its stable default
ID is textPlot. Positions accept field strings or field/datum encodings with
quantitative, temporal or categorical scales. Aggregation, binning and stacking
are rejected. text accepts a field string, { field, format? }, or { value }.
Newlines retain multiline text behavior.
Optional color uses a field encoding and its legend. Constant fill and font,
alignment, rotation, offsets, line spacing and missing-value policy belong in
style. Source appearance inheritance is not applicable to independent text.
Use createMarkLabels for labels attached to marks and createAnnotation for
annotations. Explicit fill and field color retain the child action’s conflict
rules. Positions and content remain editable with encoding actions; appearance
uses editTextMark.
data, coordinate, and guides follow shared facade behavior. Compatible
existing guides are reused; guides: false skips guide creation. Existing marks
do not become an implicit source: the facade always selects a dataset.
Documentation provenance
293 actions · sha256:e755591a2e5f5e2b494867583876e28020a478c5220b77bdc6ad469a6224891d