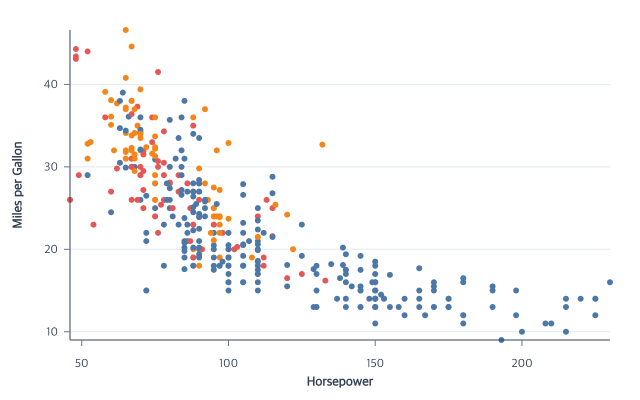
Published-release documentation · release compatibility
Chart Recipes
Use a recipe when you know the chart type and want the shortest supported action flow. Each recipe separates the decisions you must provide from the resources, defaults, and guides that ggaction can infer.
Want the reasoning?Use a tutorial for an ordered workflow and explanation of each action.
Choosing a chart?Browse complete results before selecting a minimal recipe.
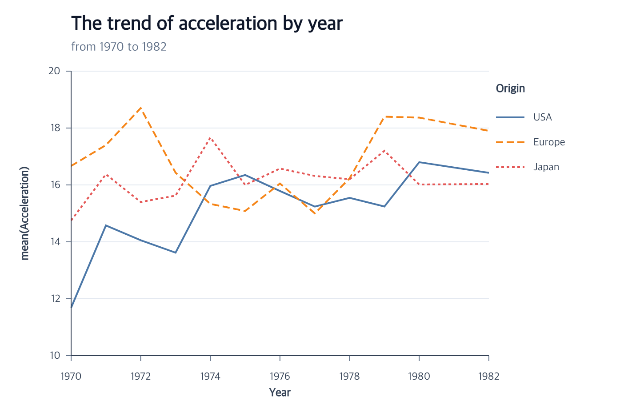
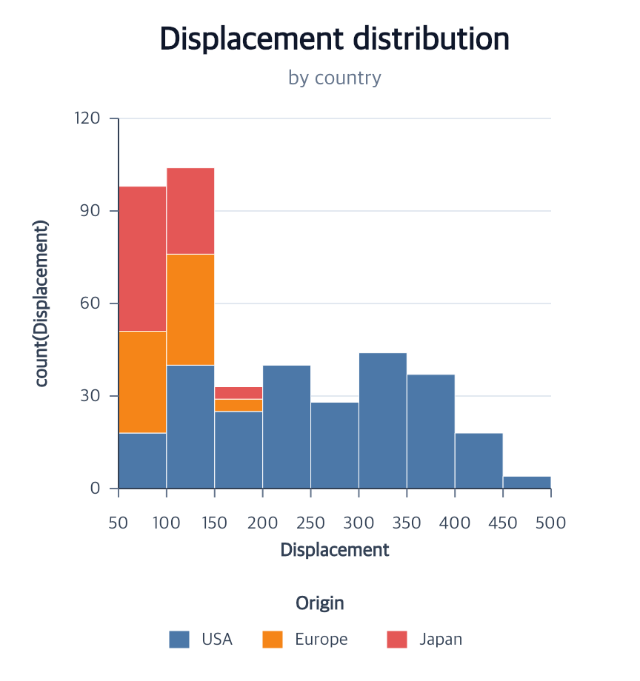
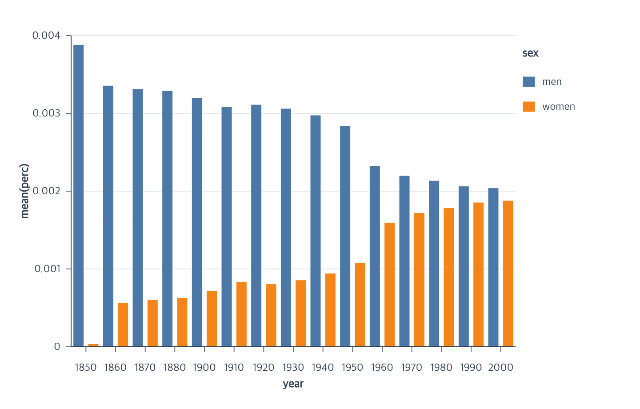
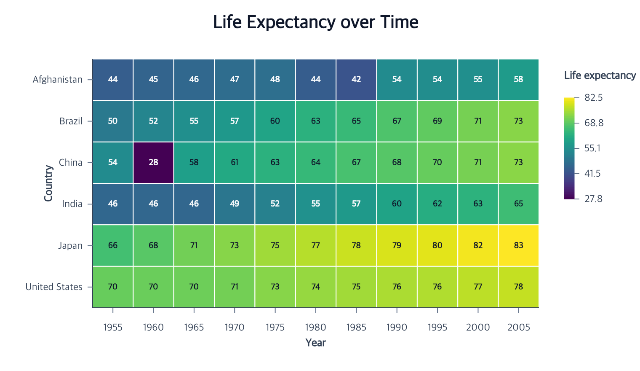
Heatmap
Map two discrete fields to cells and a quantitative field to color.
createHeatmap
createTextMark
encodeText
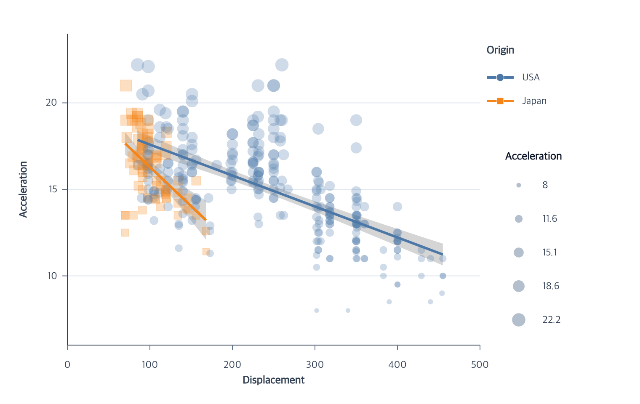
Regression scatterplot
Layer observations, grouped fits, and confidence bands.
createPointMark
createRegression
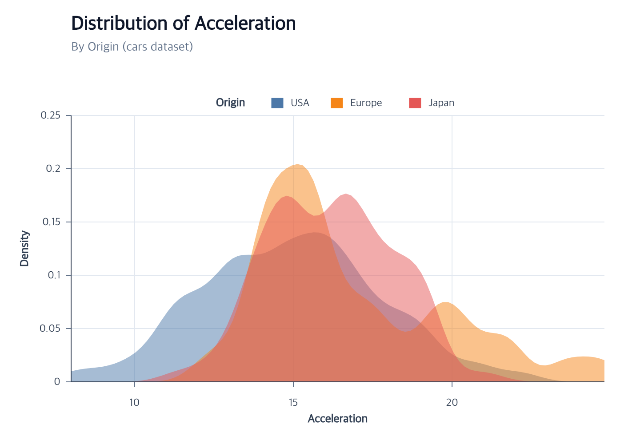
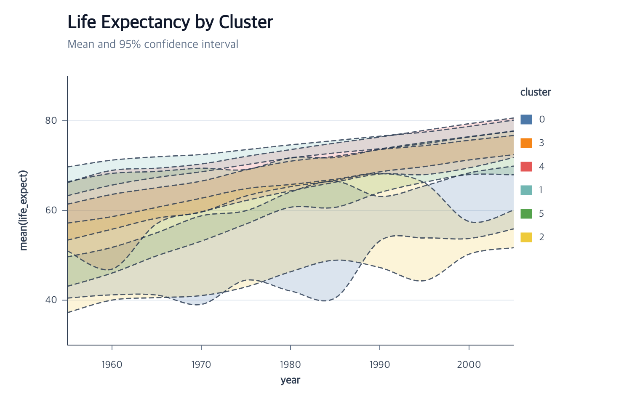
Density area
Estimate grouped distributions and draw baseline-closed areas.
createAreaMark
encodeDensity
encodeColor
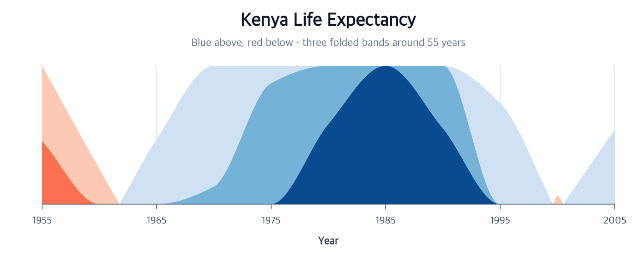
Horizon chart
Compress a long time series by folding values above and below a baseline.
createAreaMark
encodeHorizon
editHorizon
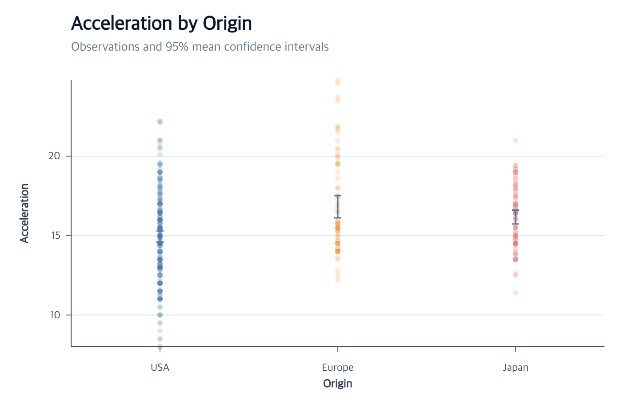
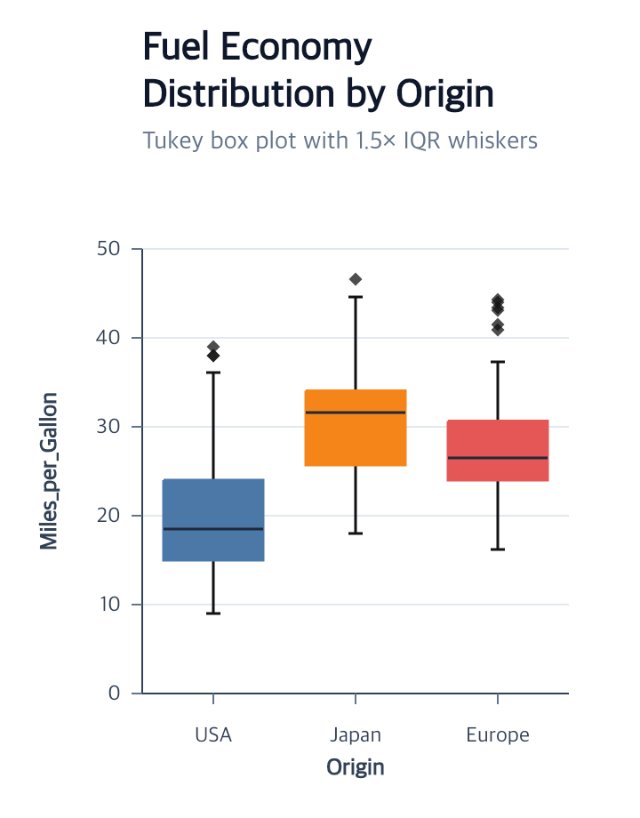
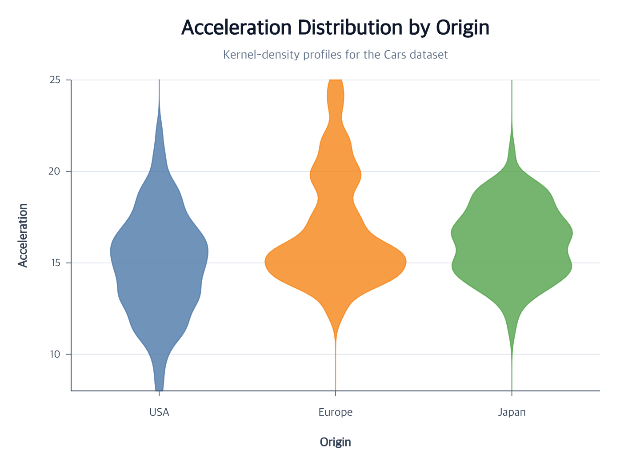
Violin plot
Compare complete distribution shapes across categories with symmetric or split density areas.
createViolinPlot
editDensity
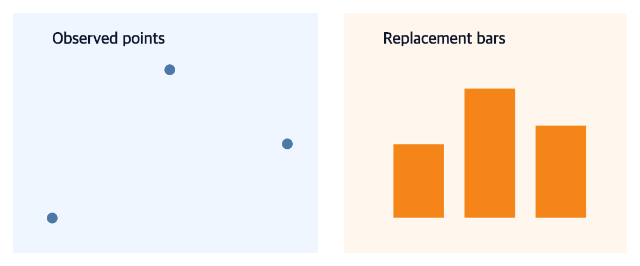
Program composition
Compare distinct child panels, edit their layout, and replace one stable slot.
hconcat
editCompositionLayout
replaceCompositionChild
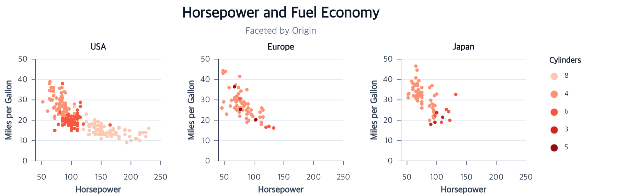
Faceted scatterplot
Repeat a complete point or bar chart by field value.
facet
editFacetHeaders
editCompositionLayout
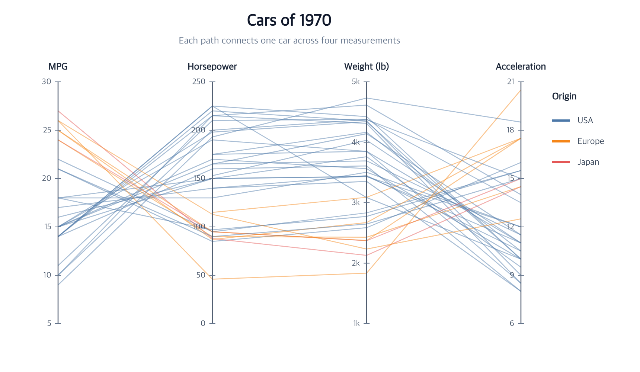
Parallel coordinates
Compare multivariate row profiles while retaining row-level identity.
createParallelCoordinates
encodeParallelCoordinates
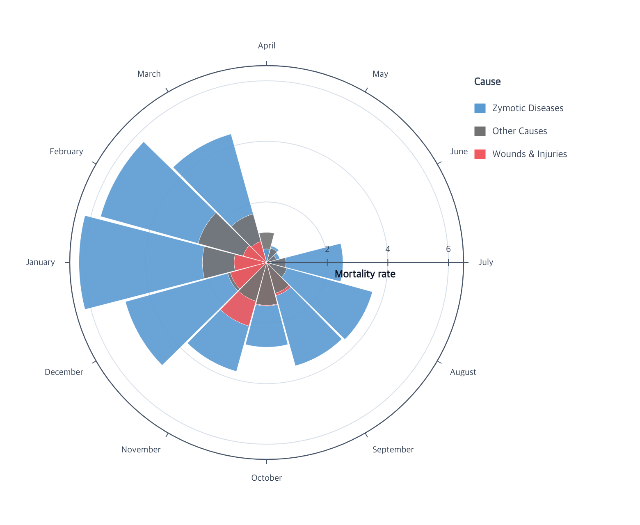
Rose chart
Compare radial magnitudes inside ordered categorical sectors.
createArcMark
encodeTheta
encodeR
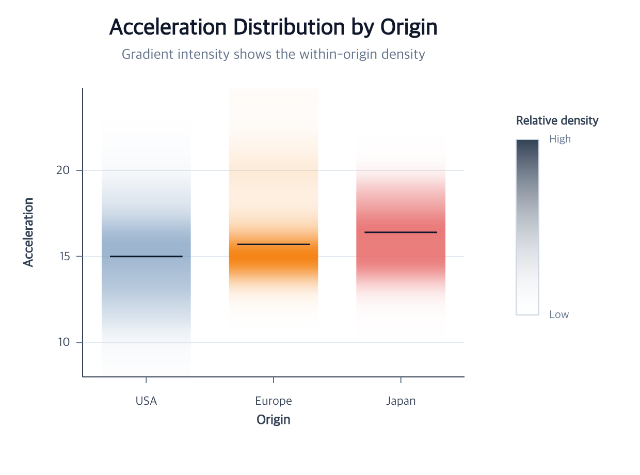
Gradient plot
Compare complete distribution shapes across categories in a compact strip.
createGradientPlot
editGradientPlot
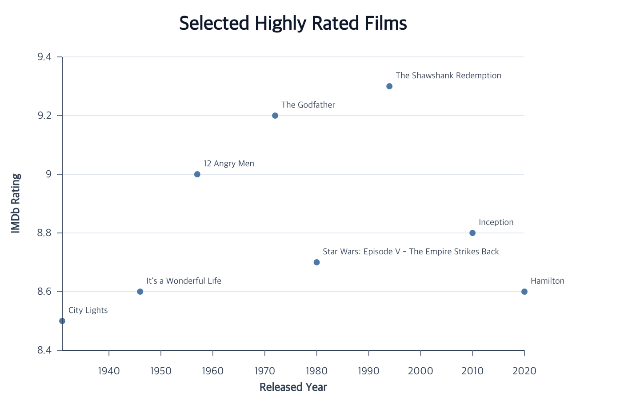
Annotated scatterplot
Attach readable data labels to final point, bar, or rule items.
createTextMark
encodeText
editTextMark
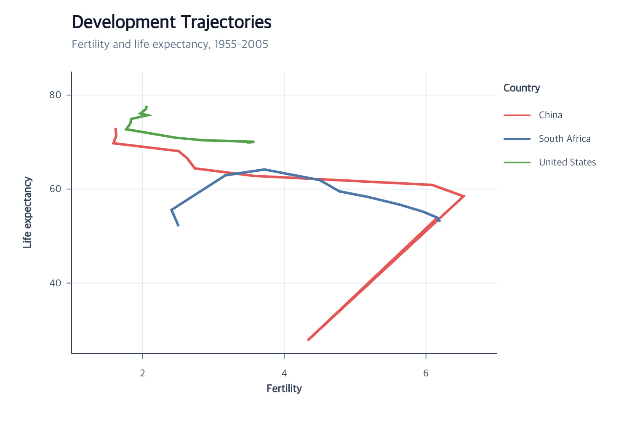
Development trajectories
Connect repeated and non-monotonic positions by a separate quantitative order field.
createLineMark
encodePathOrder
removePathOrder
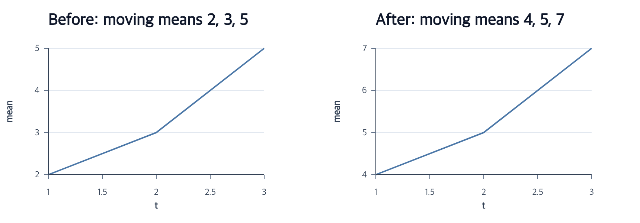
Repair missing observations
Repair missing observations with explicit inputs and immutable program revisions.
createWindowData
createLinePlot
bindMarkData
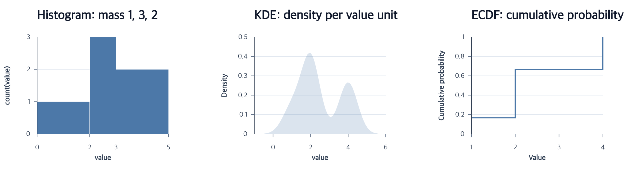
Compare weighted distributions
Compare weighted distributions with explicit inputs and immutable program revisions.
createHistogram
createDensityPlot
createECDFPlot
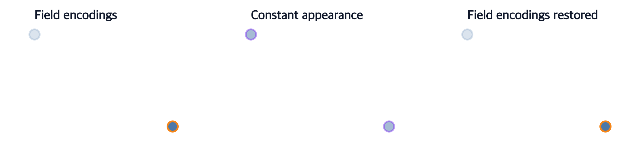
Switch encoding modes atomically
Switch encoding modes atomically with explicit inputs and immutable program revisions.
createScatterPlot
encodeChannels
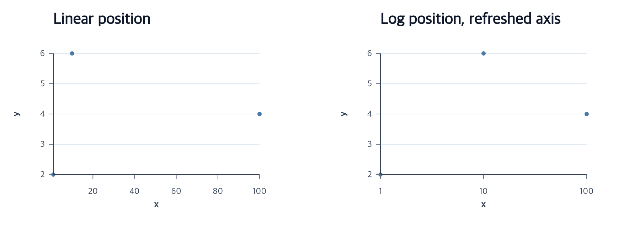
Edit scales and refresh guides
Edit scales and refresh guides with explicit inputs and immutable program revisions.
createScatterPlot
editXScale
editXAxis
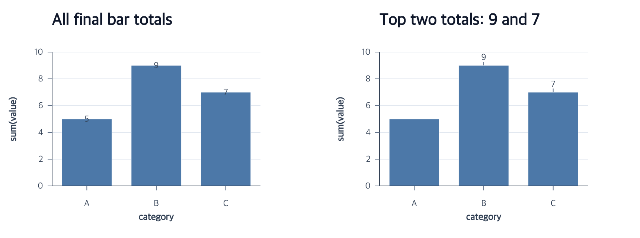
Select and place final-item labels
Select and place final-item labels with explicit inputs and immutable program revisions.
editMarkLabelSelection
editMarkLabelPlacement
layoutLabels
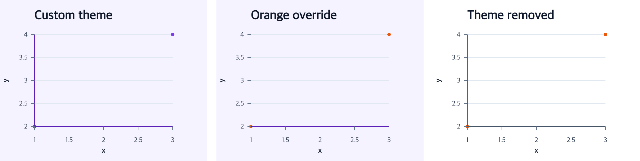
Apply, override, and remove a theme
Apply, override, and remove a theme with explicit inputs and immutable program revisions.
applyTheme
editPointMark
removeTheme
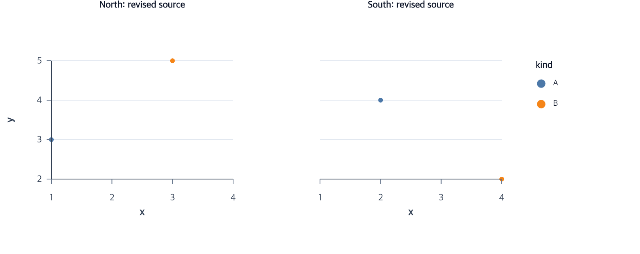
Revise facet source and shared guides
Revise facet source and shared guides with explicit inputs and immutable program revisions.
editFacetSource
editFacetHeaders
editFacetGuides
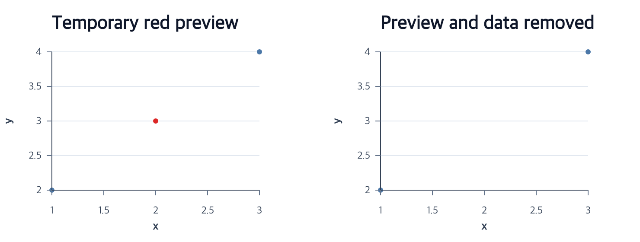
Remove resources in dependency order
Remove resources in dependency order with explicit inputs and immutable program revisions.
encodeY
removeData
removeMark
Every flow begins with createCanvas, createData, and a semantic mark or
composite action. Follow each action’s required selectors even when only one resource exists. Use stable explicit IDs for later edits; omission is available only where the action documents inference. See authoring conventions.
Each recipe labels its primary snippet as runnable. Later snippets revise the
named program produced by that primary flow unless they repeat an import and
complete setup explicitly.
Documentation provenance
293 actions · sha256:e755591a2e5f5e2b494867583876e28020a478c5220b77bdc6ad469a6224891d